Optimizing the new trait solver
Press for table of Contents
This is a more detailed writeup of all the changes we made in the past months to optimize the performance of the next trait solver. Basically, anything that didn't fit in the blog post on https://blog.rust-lang.org/2026/08/21/enabling-next-solver-on-nightly/.
In April, we started tracking the performance of the new solver better by adding more benchmarks to our performance benchmarking infrastructure that used the new solver. Importantly, that way we could also start better tracking the performance over time.
One spectacular example is thet wg-grammar benchmark, which used a lot of opaque types in a way that caused exponential slowdowns. The solution here wasn't micro-optimizations, but algorithmic changes to increase the likelyhood of cache hits.
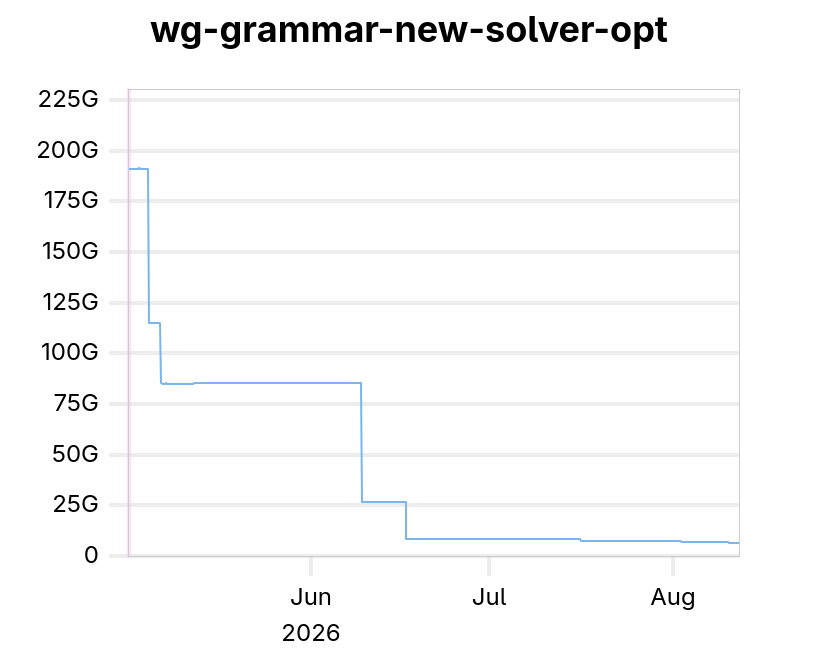
The y-axis here shows billion (G for giga) instructions executed while compiling the benchmark.
We run these benchmarks on every single merge into rust's main branch, providing valuable statistics. However, this set of benchmarks will always be slightly synthetic. So Rémy Rakic (aka lqd) started doing a crater-like run, but for performance.
To do so, Rémy downloaded the 20 000 most downloaded crates from crates.io, and measured how much slower the new solver compiled it compared to the old solver.
A process which took multiple weeks of compute time.
Based on these results, several people started addressing the outliers.
To create the graphs in this document, we took a sample of 1 000 out of these 20 000 crates, and followed them over time.
To show what happened when we started looking more into these outliers, let's look again at the graph from the main blog post:
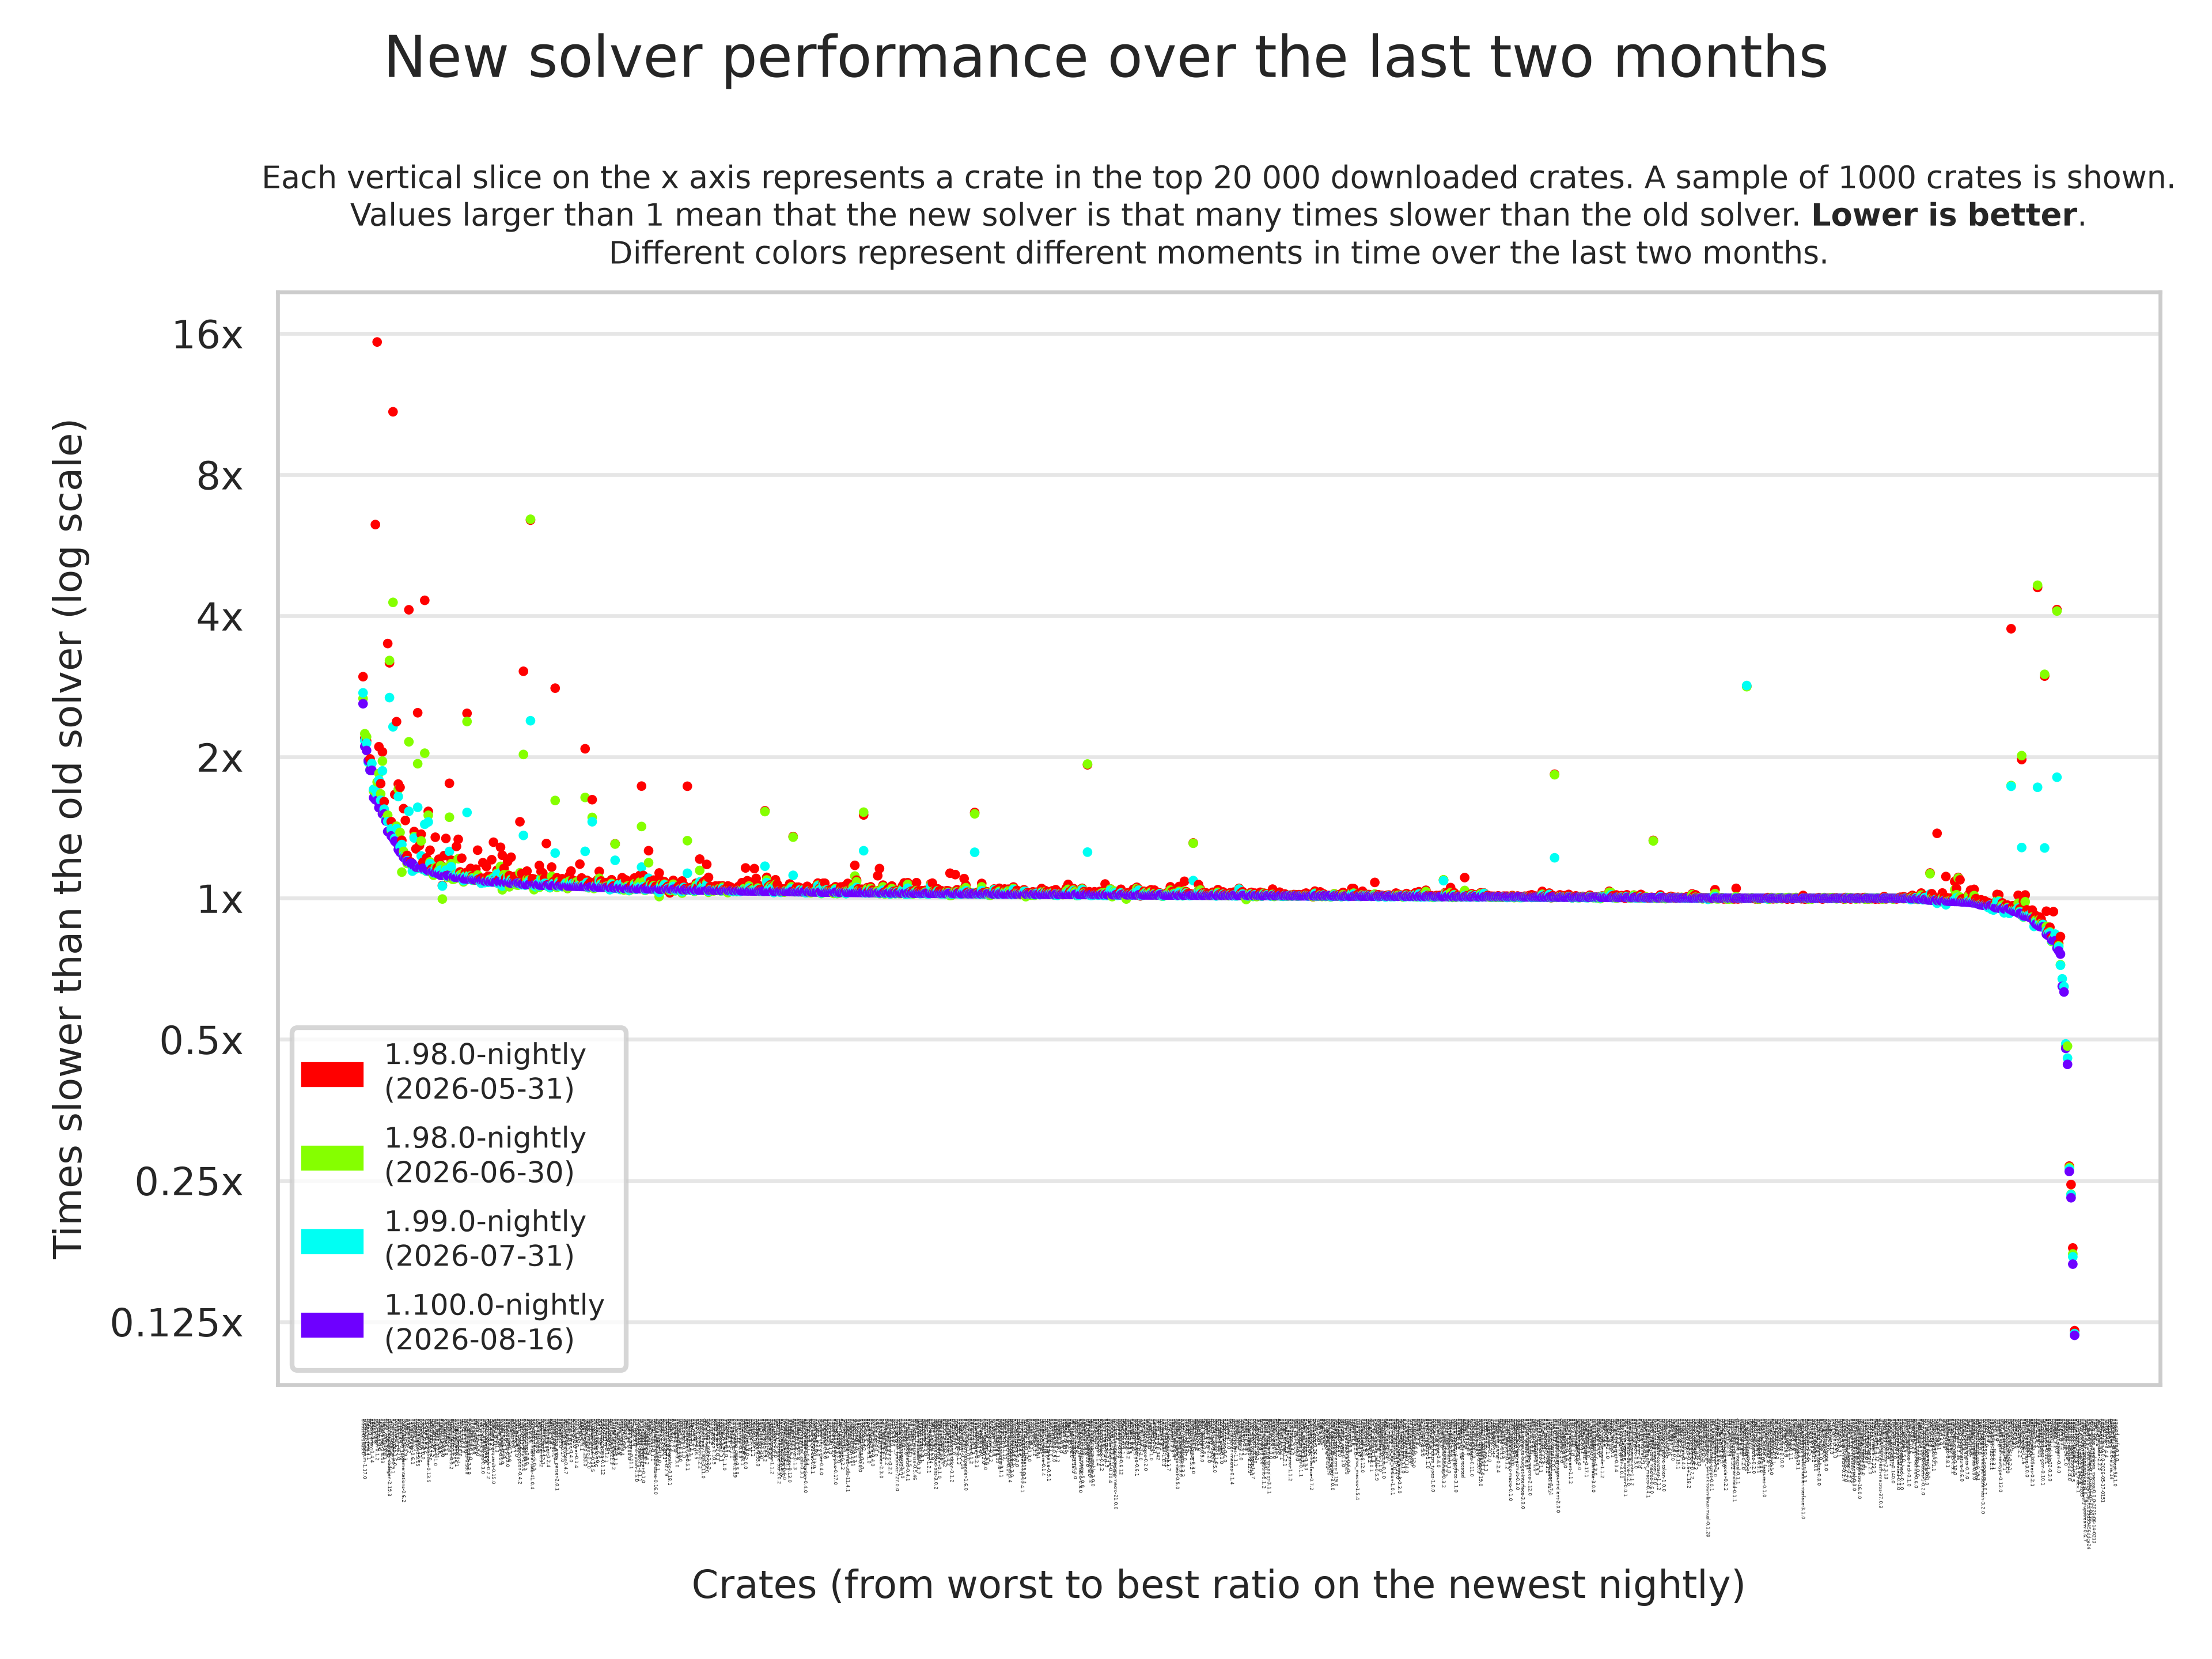
note that all graphs in this document have a logarithmic y axis!
Each vertical slice in this plot shows a single crate. Each slice ideally contains 4 datapoints (this is not always true when in an older version a crate didn't compile at all with the new solver). Each red dot represents the performance at the end of May, Green at the end of June, Cyan at the end of July, and light blue is right now.
So you can see that on the left, there are some red dots between 4x and 16x. That means that in June, there were crates that were 4 to 16x slower with the new solver than they were to compile with the old solver. In this range, 4x to 16x, we only see red and green dots, because a lot of these crates became a lot faster! The first blue dot can be found between 2x and 4x. Still bad, but much better.
More interesting to me, is the fact that on the right, we also see a lot of dots above the 1x line. So, by optimizing the very slow crates, we accidentally made them not just as fast as the old solver, but in many cases much faster.
Finally, there are a large number of crates (over 900 of the 1 000) for which the blue dot lies between 0.8 and 1.2. In other words, most crates are barely affected by the change in trait solvers.
Generating these benchmarks
These benchmarks show instruction counts (not wall time), measured with perf.
They involve 3 separate cargo commands, because I'm specifically interested in the root crate's performance,
not its dependencies.
So for a crate named mrow, it would look something like this:
cargo check
cargo clean -p mrow
perf ... -- cargo check
The cargo clean in the middle deletes only the specific crate given, in our case the root crate mrow.
On each compiler version, on each crate, I'd then run that sequence of commands twice.
Once with -Znext-solver=coherence and once with -Znext-solver=globally to see the difference in instruction counts.
See my code to gather the data here: https://git.donsz.nl/jana/new-solver-perf And no, I won't show my plotting code. It's the ugliest python I've ever written. Oh my gods. You'd die reading it. And I've written some ugly python code in the past
Change from last week
The graph above was generated with the newest datapoints on nightly-2026-08-16. However, I've been running the benchmark script almost every day this past week.
Looking at a similar graph from last week (nightly-2026-08-09), a lot of changes can be seen:
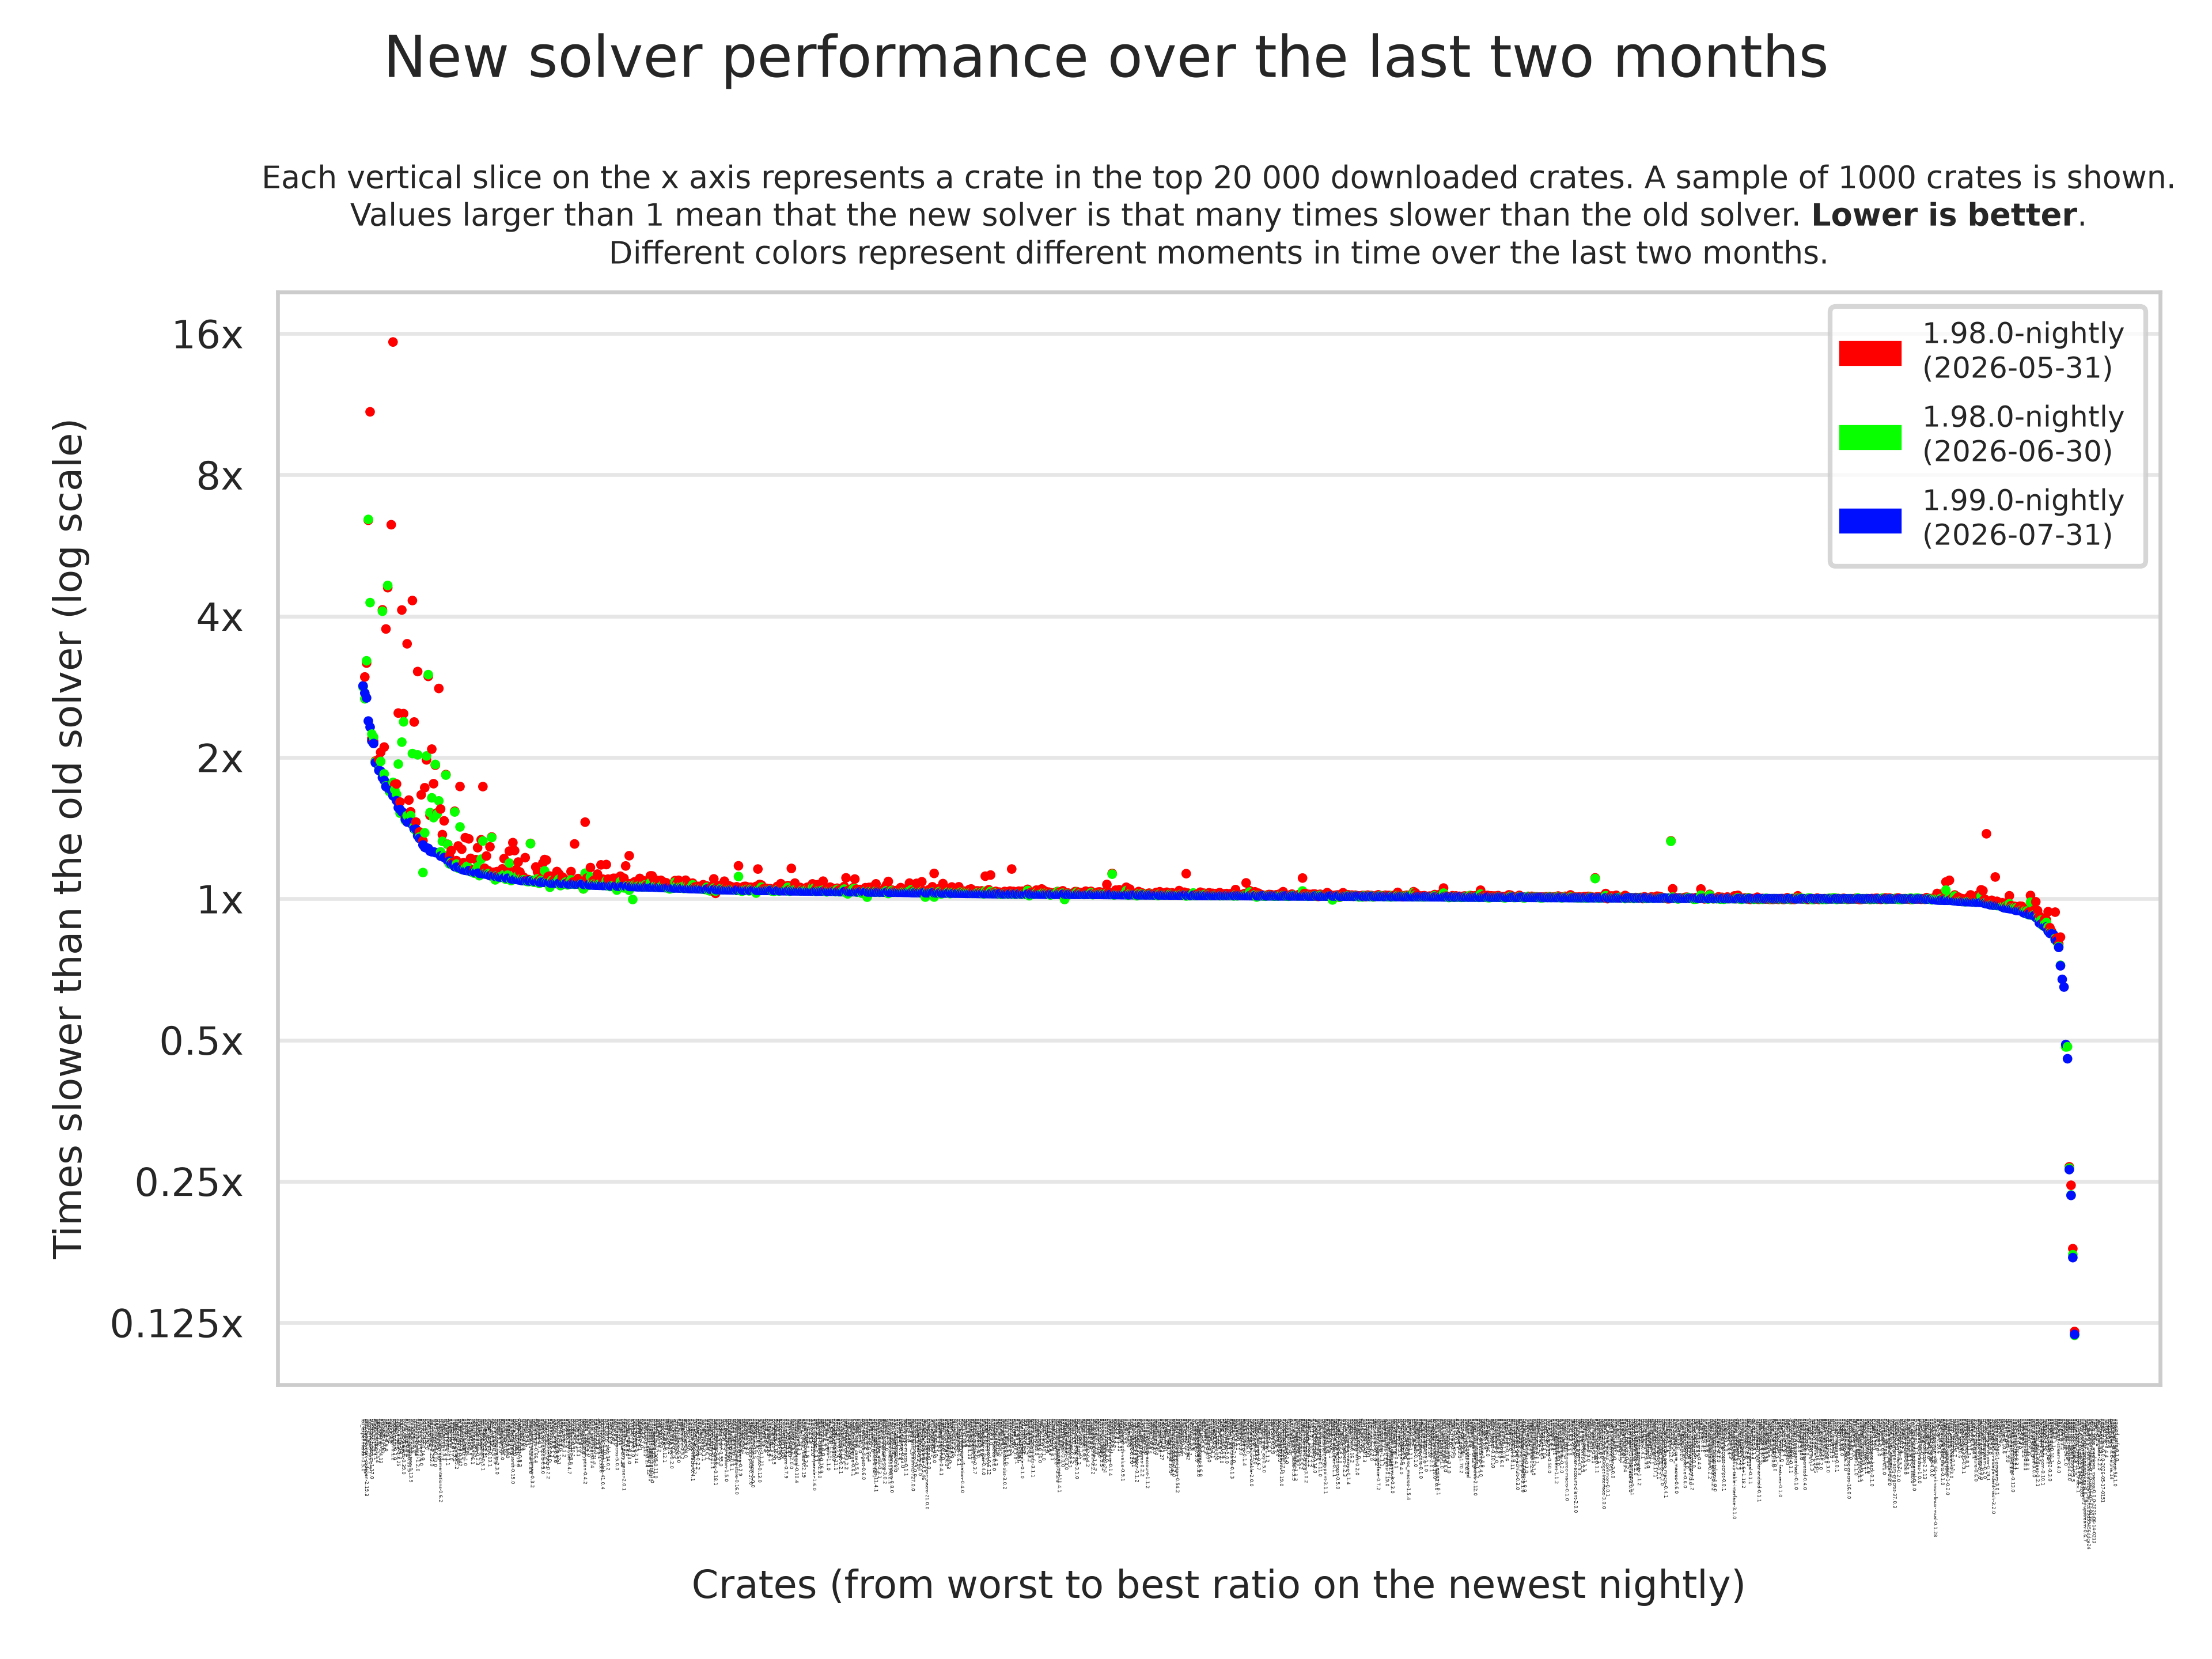
The older graph's line of points has a slightly smoother bend in the bottom-left, but that's just a funny coincidence I think. The change I'm interested here is that fewer points in the middle (where the line is around 1.0x) have older datapoints (red, green, cyan) above them. In this old graph, some crates are not as optimized yet, and are sorted towards the left, where in the new graph these points are sorted towards the center of the graph (i.e. their current performance is closer to 1.0x and closer to all the other crates).
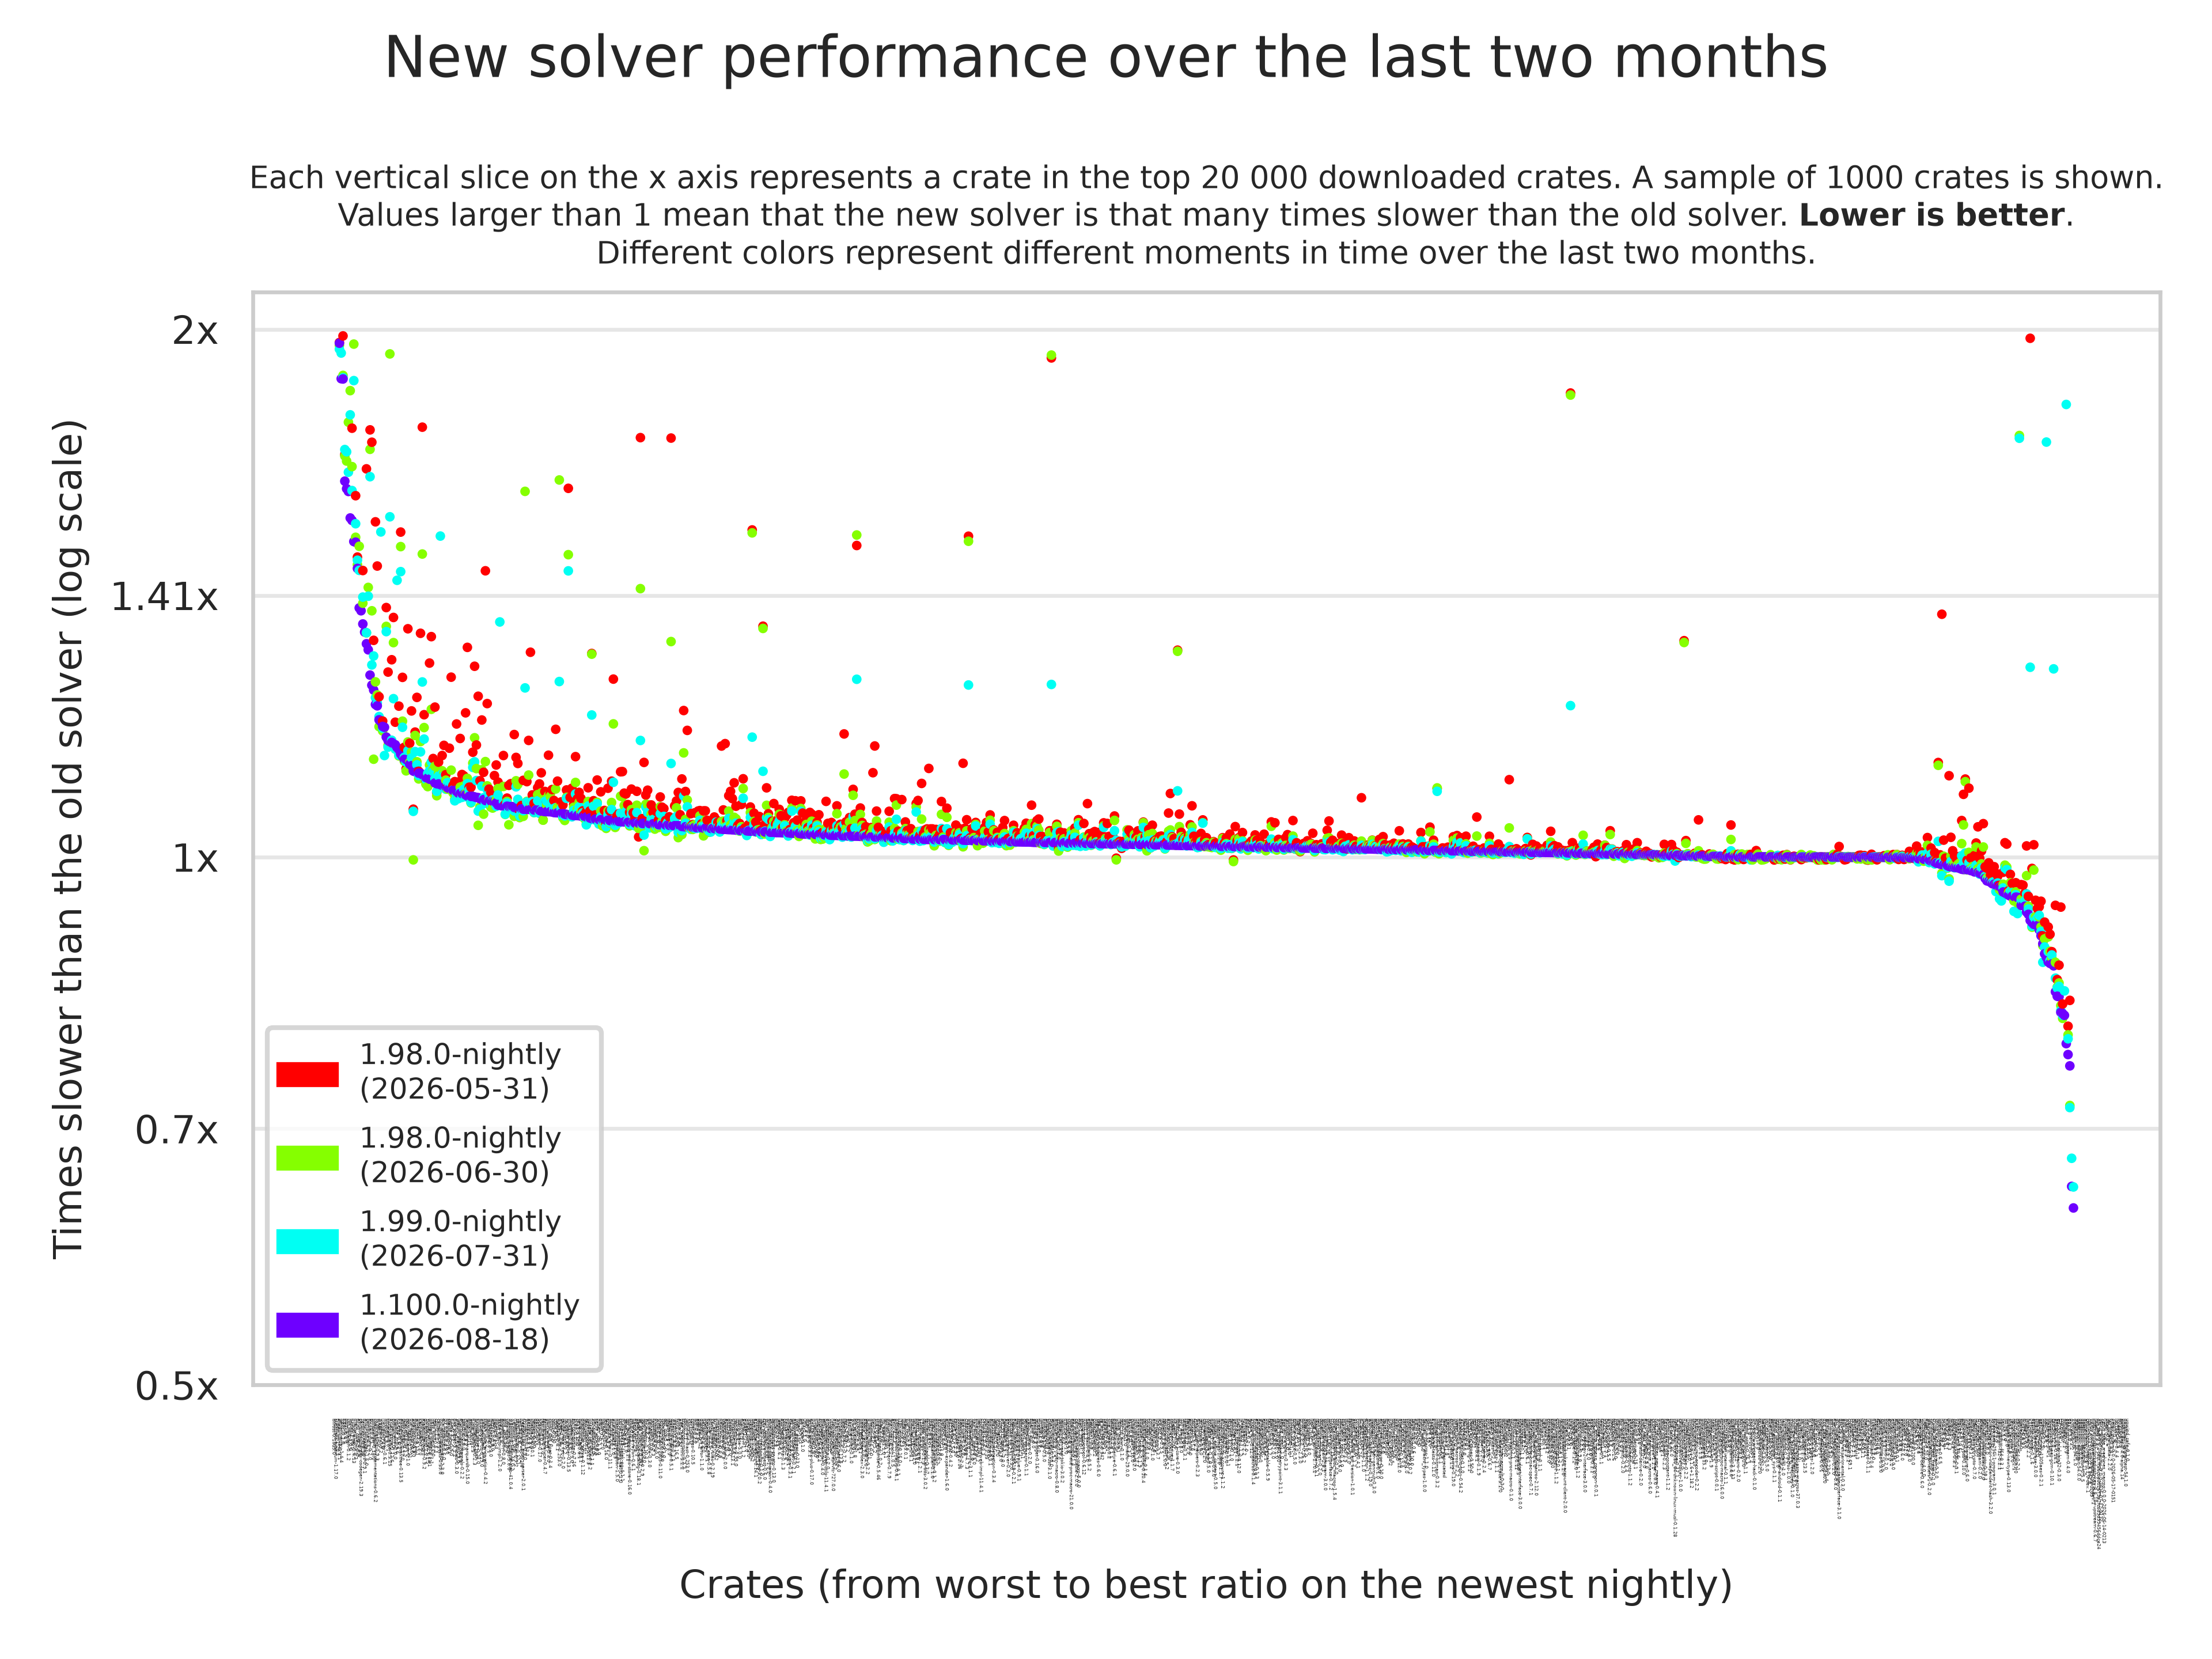
Zoomed in around 0.5x - 2x
As requested on lobsters, here's a zoomed-in version from between y=0.5 to y=2.0. Before you ask, the ticks inbetween are √2 and 1/√2 because that's what happens to equal spacing on log plots :3
Individual sorting
Several people who I showed the above graphs asked me if I could make a small change, sorting all datapoints.
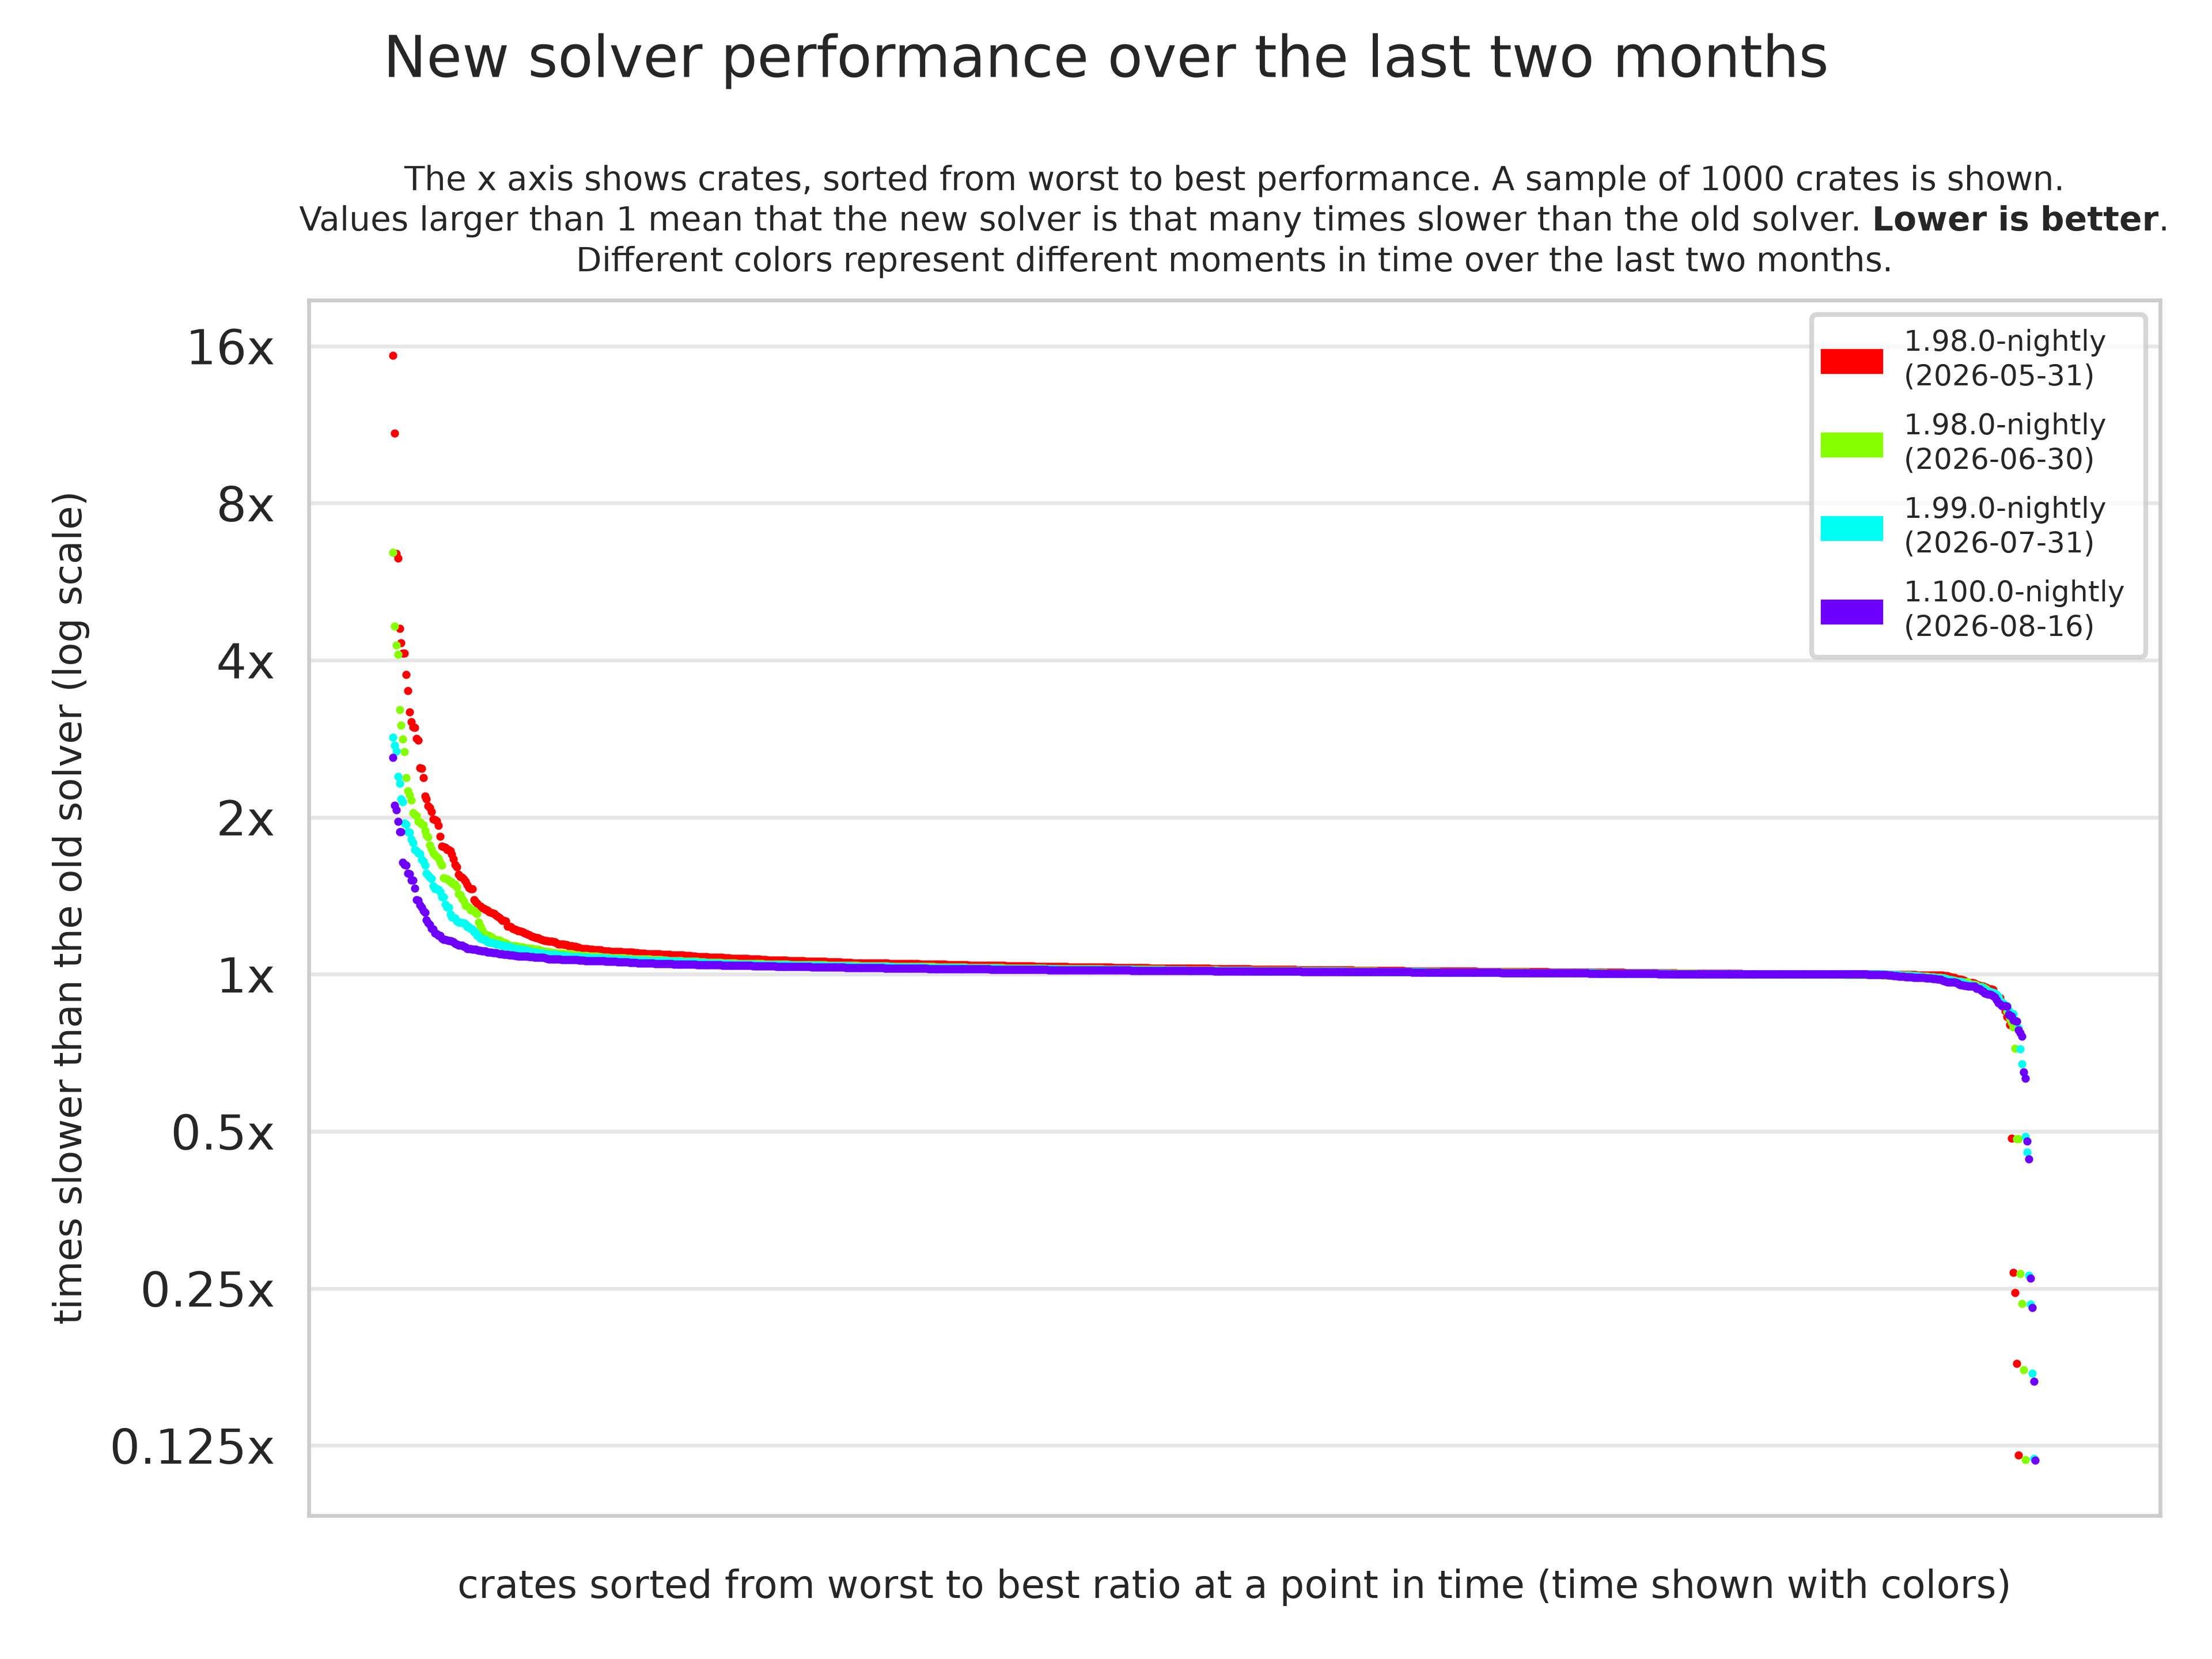
I find this slightly less informative, since you can't see the per-crate progression as easily. But it does show the total progression over time better.
Crates as lines
Finally, I'd like to show you the very first way I tried visualizing this data, by following the progression of individual crates as lines.
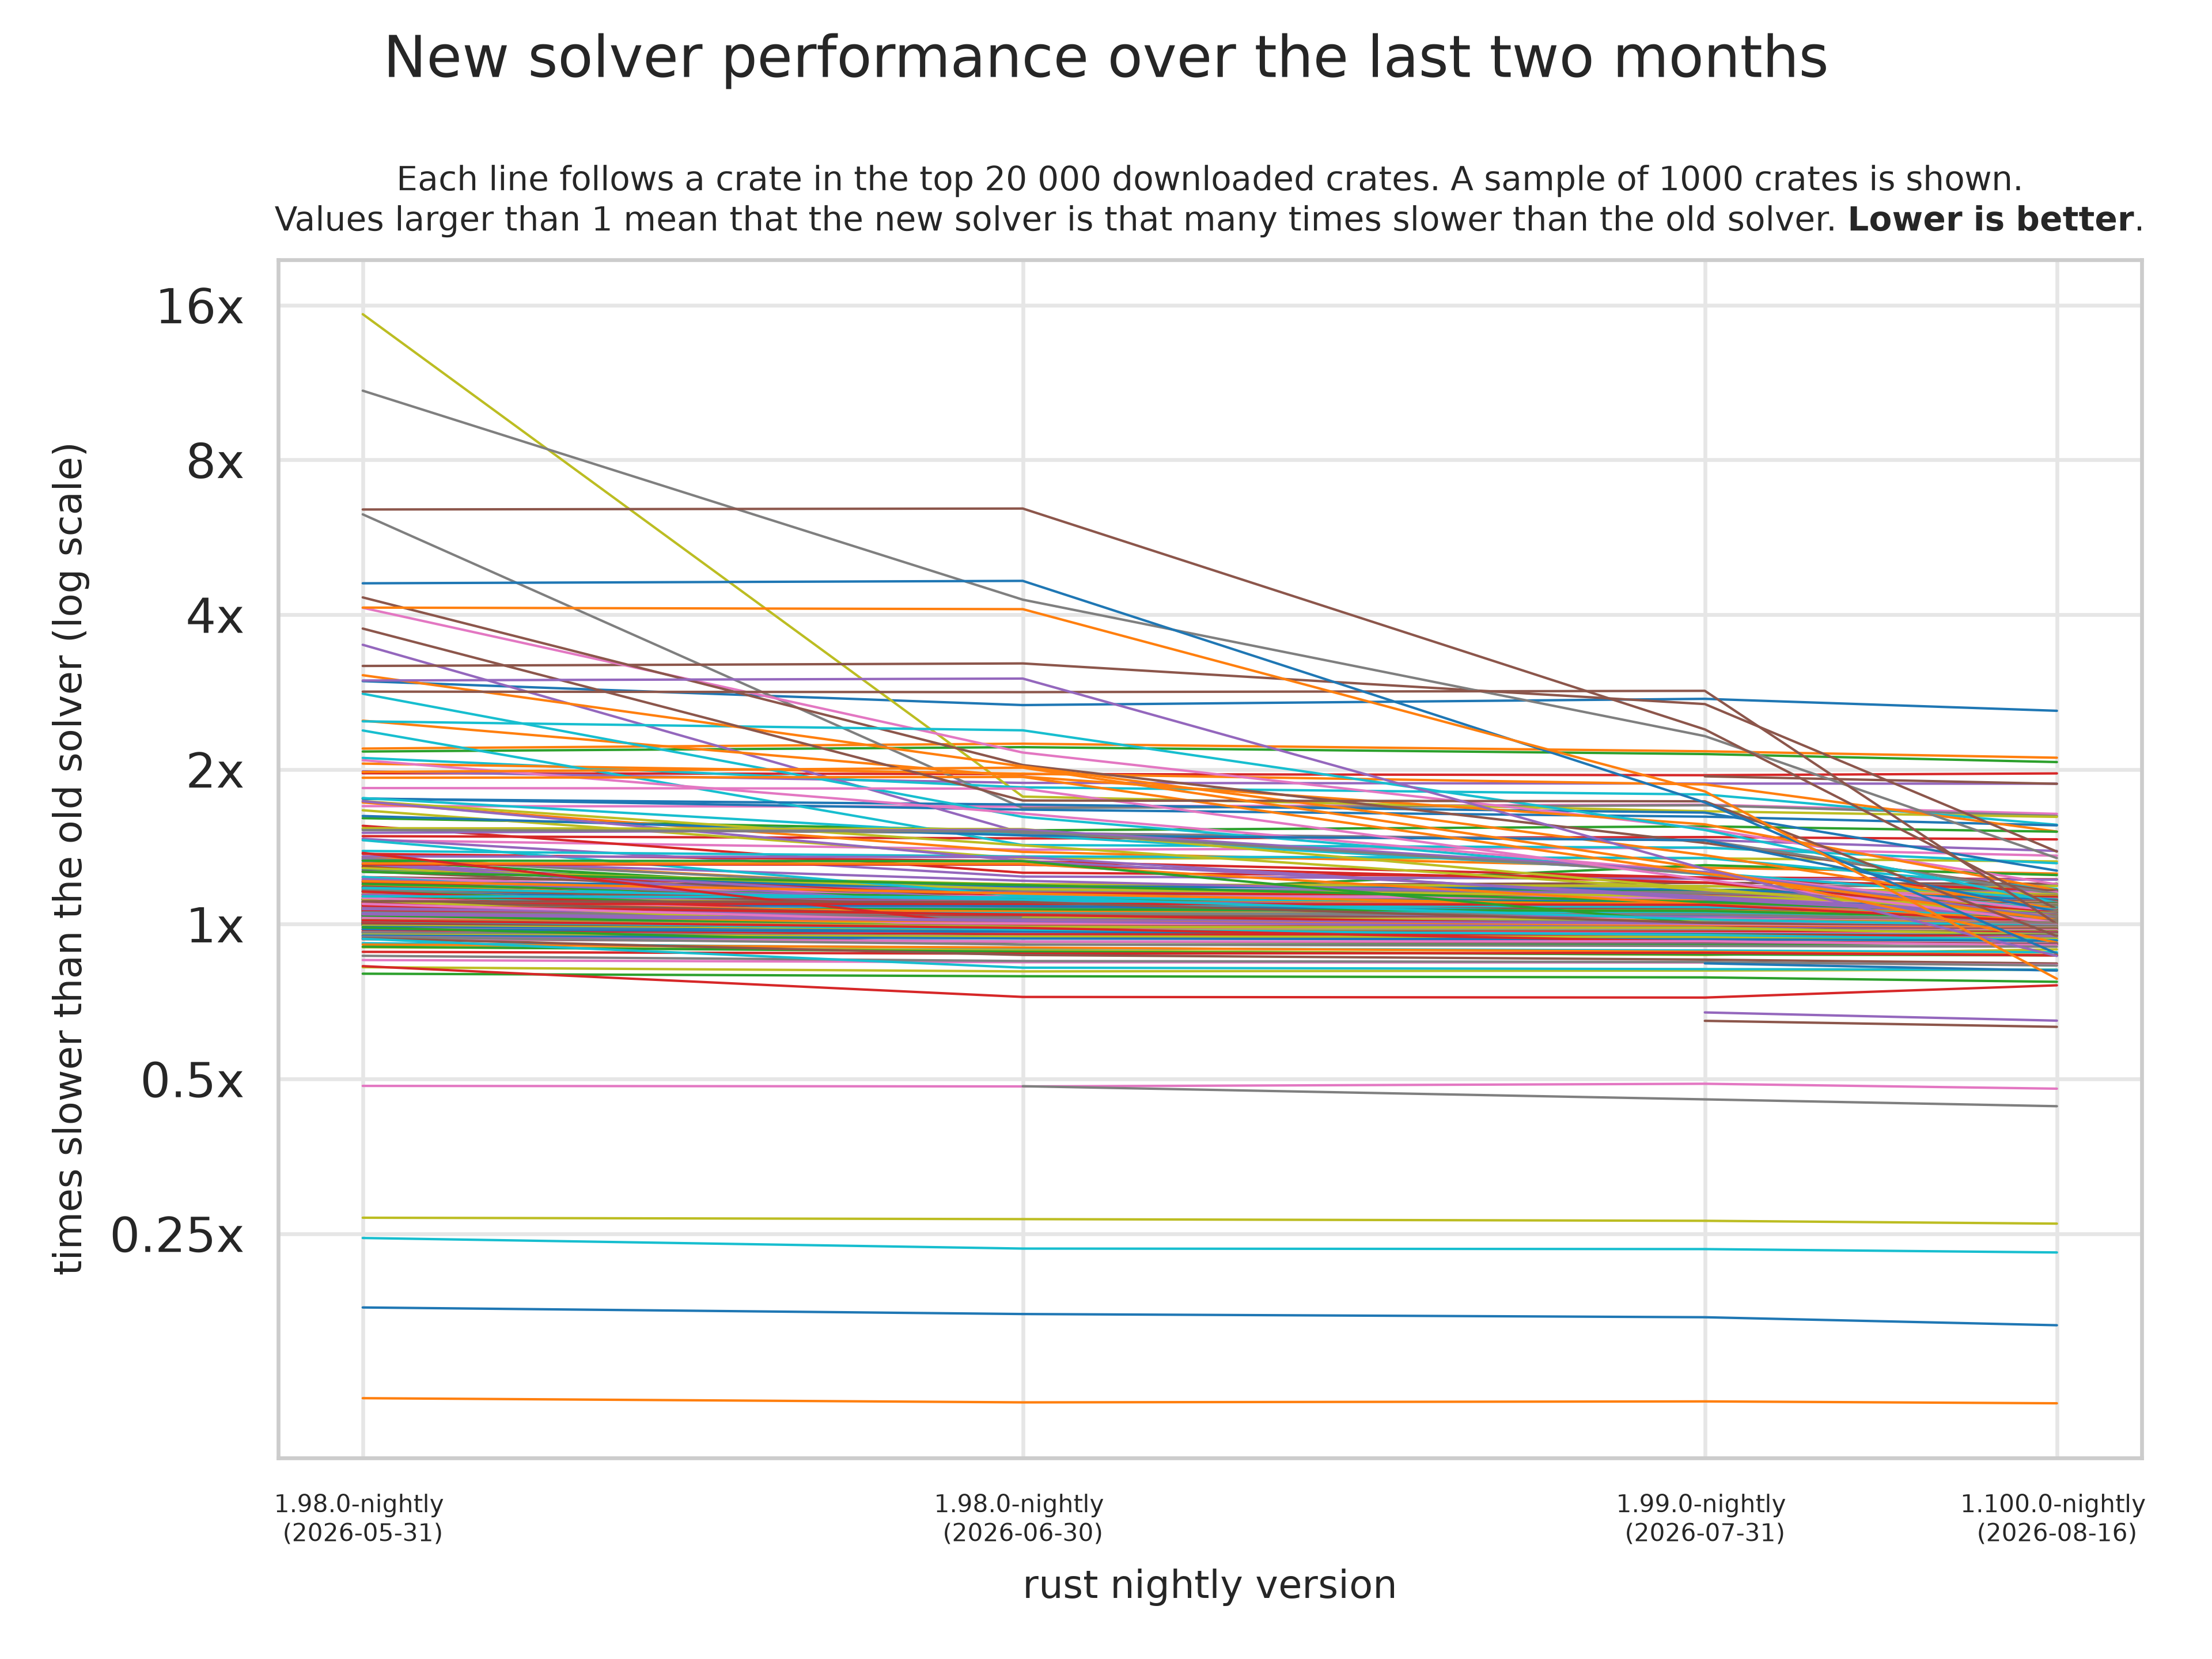
The result, I admit, is a little messy. That's a lot of lines! However, there are interesting things to learn here anyway:
- A couple crates used to be extremely slow two months ago (up to 16x slower with the new solver than they were with the old solver), and many of those are much closer to 1x now, even if not fully mitigated. These are the cases that we've been caring a lot about recently.
- The density of crates between 1.5x and 4x slower has gone down significantly (from 42 to 24 of the 1 000 in this plot).
- A lot of crates (more than 900 of the 1 000 in this plot) hover between 0.8 and 1.2x slower, and are roughly stable there. That means many crates have similar performance with the old and new solver.
- A couple of outliers are massively faster with the new solver! Those are all the lines below 1x.
We didn't label any crates in any of these graphs, but some of the outliers that might be interesting are:
typenum-1.20.1(consistently around 2.1x slower than the old solver).nacl-0.5.3(which we brought from 4.5x slower to only 1.7x slower than the old solver).nom-8.0.0which went from 6.2x slower to only 1.6x slower.datafusion-0.5.3which is one of the crates that is almost 4x faster under the new solver, one of the lines far below 1x.astrology-3.0.3is a crate that started at 4.1x slower, and over the past months went down to being 20% faster than the old solver.
A short list of performance issues resolved in the past months
Note, the explanations in this section are majorly simplified to hopefully be interesting to a larger audience.
TypingMode::Erased
See #155443, #156246, #157910,
Queries to the trait solver involving opaque types (return-position impl trait), often result in cache misses. To mitigate, we pre-process such queries, stripping out all mentions of opaque types, noting down whether the evaluation of the query actually ever uses the information of these opaque types. If it turns out we don't, the result without opaques is valid, and the cache entry is more general. If the opaque types were relevant, we will retry such queries with the original opaque types.
Since we now sometimes do double work, there are cases in which this is a slowdown. However, much more often than not it helps with performance.
Quadratic slowdowns in unic-ucd-name
In all the graphs above, one datapoint is purposefully omitted. The crate unic-ucd-name used to be 214x slower with the new solver than with the old solver...
It simply didn't fit on the graph.
After #160982 it's now at 1.07x slower, which is much more acceptable.
The culprit was code like this (minimized by mira):
pub const A: &[&[&str]] = &[
    &["A"],
    &["A"],
    &["A"],
    // ...
    &["A"],
    &["A"],
];
With the new solver, this code would scale quadratically in the number of items in the outer slice.
And unic-ucd-name has a slice of tens of thousands of these (enumerating unicode codepoints).
The problem was that the new solver can sometimes cause lifetime "infer vars" (like type variables but for lifetimes) to be unified.
And, somwhere in NLL code, we'd call into the trait solver, and then undo all changes to the lifetime inference storage (a union-find datastructure).
This undoing would iterate over every lifetime in the storage.
However, there's also a flag: if no lifetimes were touched, we'd skip the iteration.
The old solver wouldn't touch lifetimes, so would never do this iteration.
Since we run this code once for each slice in the example above, and each time we undid an operation we'd iterate over N lifetime variables (two per slice, also one for the string inside),
we get quadratic performance.
These kinds of situations occur frequently, where we change something in the new solver, that has a cascading effect into unrelated code that suddenly increases the computational complexity.
The above change of adding TypingMode::Erased has a similar (exponential) speedup effect on some crates.
Less re-evaluation of stalled queries
Query evaluation is a fixpoint loop. We evaluate a list of queries, and find out that some cannot be evaluated yet. We say that those queries are stalled, until some progress is made on another query. After we've attempted to make progress on all queries, we could naively restart at the start of the list, retrying all queries to see if they can now make more progress.
However, a lot of work went into not unnecessarily retrying queries when we already know they cannot make further progress. For each query, we keep some metadata, trying to remember what they are stalled on. We then only retry a query if something changes that can actually affect it.
Time invested in optimizing this stalling process turned out to give major gains:
- #156187 skips more goals by ensuring more up-to-date information is used
- #160479 micro-optimizes allocation in the fixpoint loop, streamlining the hottest paths as much as possible
- #158042 the check to abort queries that are stalled lived at the start of one of the hottest functions in the solver, but also one of the biggest functions. LLVM dealt with this poorly, not properly optimizing the fast path independently from this big function with lots of logic. By splitting it into a smaller function handling the fast path, and a larger function for the slow path lots of performance was gained.
- #160886 and #158436 making the datastructure that contains metadata about stalled queries smaller.
Note that this list is far from complete. A lot of micro-optimization was also done which are harder to "explain" or give context for. See https://github.com/rust-lang/goals/issues/113 for a complete list of work.
NO large language models were or are used in any of my open source contributions or anything I do. Not for proof-reading, not for trying out random ideas, not for generating code or text. LLMs and the companies that create and sell them destroy communities and the world around us. If you see something that I made online: that is me, and I take full responsibility for it.